|
|
|
|
|
|
|
|
|
|
|
|
|
|
|
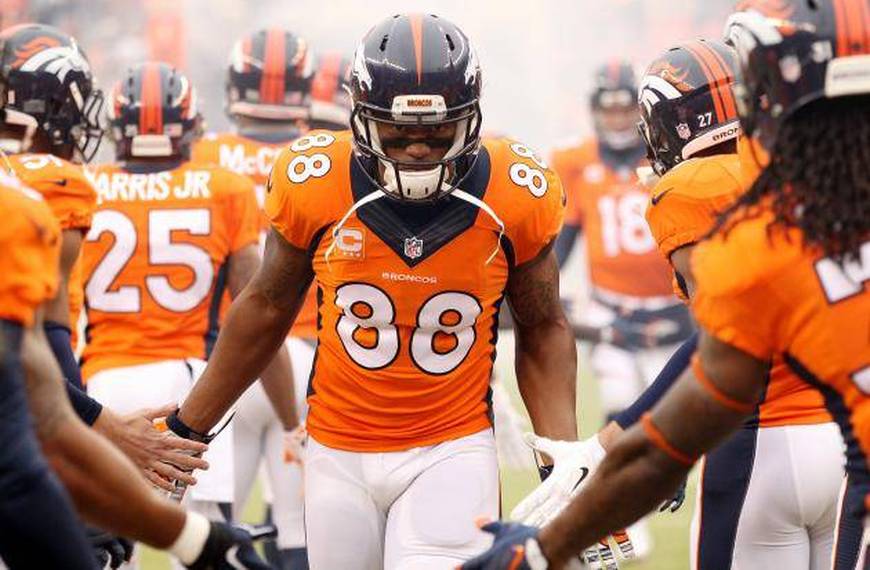
The Broncos have had a disappointing season with a 3-9 record and inconsistent play, particularly on the offensive side. However, they’ve had one of the best defenses of the season at yards per game, ranked No. 5 in the NFL at 295.6 yards per game.
This has not translated to keeping teams out of the end zone, however, as the Broncos are No. 31 in points per game allowed, giving up an average 26.3. A major issue for Denver has been its propensity to surrender turnovers, for which it has the second highest total in the league. Here’s Tim Benz to break down the crazy defensive statistics of the Denver Broncos in 2017. |
Skill OneOnce you have collected quantitative data, you will have a lot of numbers. It’s now time to carry out some statistical analysis to make sense of, and draw some inferences from, your data.
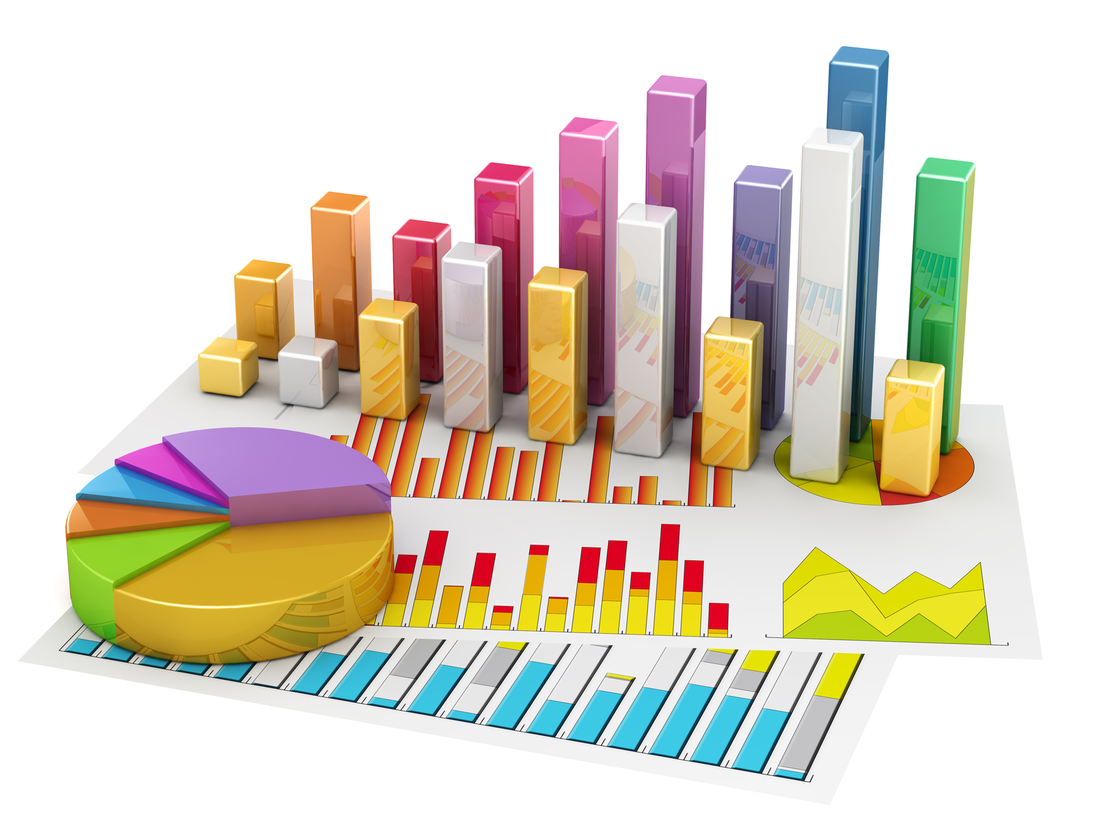
There is a wide range of possible techniques that you can use. This page provides a brief summary of some of the most common techniques for summarising your data, and explains when you would use each one. Summarising Data: Grouping and VisualisingThe first thing to do with any data is to summarise it, which means to present it in a way that best tells the story. The starting point is usually to group the raw data into categories, and/or to visualise it. For example, if you think you may be interested in differences by age, the first thing to do is probably to group your data in age categories, perhaps ten- or five-year chunks. One of the most common techniques used for summarising is using graphs, particularly bar charts, which show every data point in order, or histograms, which are bar charts grouped into broader categories. Read more at: https://www.skillsyouneed.com/num/simple-statistical-analysis.html |

Skill TwoAverages
Read more at: https://www.skillsyouneed.com/num/simple-statistical-analysis.html The average gives you information about the size of the effect of whatever you are testing, in other words, whether it is large or small. There are three measures of average: mean, median and mode. See our page on Averages for more about calculating each one, and for a quick calculator. When most people say average, they are talking about the mean. It has the advantage that it uses all the data values obtained and can be used for further statistical analysis. However, it can be skewed by ‘outliers’, values which are atypically large or small. As a result, researchers sometimes use the median instead. This is the mid-point of all the data. The median is not skewed by extreme values, but it is harder to use for further statistical analysis. The mode is the most common value in a data set. It cannot be used for further statistical analysis. The values of mean, median and mode are not the same, which is why it is really important to be clear which ‘average’ you are talking about. Read more at: https://www.skillsyouneed.com/num/simple-statistical-analysis.html |

Skill ThreeMeasures of Spread: Range, Variance and Standard DeviationResearchers often want to look at the spread of the data, that is, how widely the data are spread across the whole possible measurement scale.
There are three measures which are often used for this: The range is the difference between the largest and smallest values. Researchers often quote the interquartile range, which is the range of the middle half of the data, from 25%, the lower quartile, up to 75%, the upper quartile, of the values (the median is the 50% value). To find the quartiles, use the same procedure as for the median, but take the quarter- and three-quarter-point instead of the mid-point. The standard deviation measures the average spread around the mean, and therefore gives a sense of the ‘typical’ distance from the mean. The variance is the square of the standard deviation. They are calculated by:
To calculate the standard deviation, take the square root of the variance. Read more at: https://www.skillsyouneed.com/num/simple-statistical-analysis.html |
